January 1, 0001
Introduction
In this study, I’ve applied some basic data manipulation and statistical methods to one of my favorite works of fiction, the Game of Thrones series by George R.R. Martin! In particular, I wanted to differentiate between the influence of characters between the books compared to the show, seeing as how the two stories have greatly diverged. I also wanted to see which characters were the most influential overall.
I combined 4 datasets I found online with information on the Game of Thrones TV series and the ASOIAF novel series. These datasets consisted of variables such as wordcount, screentime, number of episodes, number of chapters, etc. These variables demonstrate the amount of focus each character gets in the books and/or the show. Analysis of this data will show which characters are the most important as well as how certain characters will have no book POV chapters, but became main characters in the show.
library(tidyverse)
library(dplyr)
got1 <- read.csv("https://raw.githubusercontent.com/apatni97/CompProject1/main/got1.csv")
got2 <- read.csv("https://raw.githubusercontent.com/apatni97/CompProject1/main/got2.csv")
got3 <- read.csv("https://raw.githubusercontent.com/apatni97/CompProject1/main/got3.csv")
got4 <- read.csv("https://raw.githubusercontent.com/apatni97/CompProject1/main/got4.csv")

got5 <- got1 %>% full_join(got2)
got6 <- got3 %>% full_join(got4)
Joining and Tidying Data
In order to perform statistical analysis, I had to use R libraries for data wrangling (dplyr, tidyverse) in order to manipulate, reorganize, and clean the datasets. This way I could collect all the data into a single dataframe so that I can analyze all characters together, as well as quickly filter out non-POV characters.
I performed a full join on the datasets because there are many rows containing NA’s that are still important to the study. For example, certain characters have data only for their show appearances but not for their book appearances because they were not POV characters. Other characters are POV characters in both the books and the TV show. I distinguish between these two conditions later on as I manipulate and analyze the data. Since this was a full_join, no cases were dropped.
I also had to use a function to merge some duplicate rows together so that there were no NA’s and each character had all of their data points. I used the dplyr function group_by to merge the duplicates by name.
got7 <- got5 %>% full_join(got6)

got7 <- got7 %>% dplyr::select(-first, -second, -third, -fourth, -fifth, -imdb_url, -portrayed_by_name, -X, -X.1, -X.2, -X.3, -X.4, -X.5, -X.6, -X.7)
got7 <- got7 %>% rename(WordCount=total)

sum_NA <- function(x) {if (all(is.na(x))) x[NA_integer_] else sum(x, na.rm = TRUE)}

got7B <- got7 %>% group_by(Name) %>% summarise_if(is.numeric, funs(sum_NA))

got7B <- got7B[!(got7B$Name=="Eddard 'Ned' Stark"),]

got7B <- got7B %>% group_by(Name)
got7B[got7B$Name=='Daenerys Targaryan', "first_appearance"] <- 2011
got7B[got7B$Name=='Daenerys Targaryan', "episodes_appeared"] <- 62
got7B[got7B$Name=='Daenerys Targaryan', "last_appearance"] <- 2019
got7B[got7B$Name=='Daenerys Targaryan', "first_appearance"] <- 2011
got7B[got7B$Name=='Daenerys Targaryan', "Total.Pages"] <- 434
got7B[got7B$Name=='Daenerys Targaryan', "Total.Chapters"] <- 31
got7B[got7B$Name=='Daenerys Targaryan', "Total.Pages..GOT."] <- 112
got7B[got7B$Name=='Daenerys Targaryan', "Total.Chapters..GOT."] <- 10
got7B[got7B$Name=='Daenerys Targaryan', "Total.Pages..COK."] <- 66
got7B[got7B$Name=='Daenerys Targaryan', "Total.Chapters..COK."] <- 5
got7B[got7B$Name=='Daenerys Targaryan', "Total.Pages..SOS."] <- 109
got7B[got7B$Name=='Daenerys Targaryan', "Total.Chapters..SOS."] <- 6
got7B[got7B$Name=='Daenerys Targaryan', "Total.Pages..FFC."] <- 0
got7B[got7B$Name=='Daenerys Targaryan', "Total.Chapters..FFC."] <- 0
got7B[got7B$Name=='Daenerys Targaryan', "Total.Pages..DWD."] <- 147
got7B[got7B$Name=='Daenerys Targaryan', "Total.Chapters..DWD."] <- 10
got7B[got7B$Name=='Daenerys Targaryan', "screentime"] <- 221.3


got7B[got7B$Name=='Catelyn Stark', "Total.Pages"] <- 333
got7B[got7B$Name=='Catelyn Stark', "Total.Chapters"] <- 25
got7B[got7B$Name=='Catelyn Stark', "Total.Pages..GOT."] <- 127
got7B[got7B$Name=='Catelyn Stark', "Total.Chapters..GOT."] <- 11
got7B[got7B$Name=='Catelyn Stark', "Total.Pages..COK."] <- 110
got7B[got7B$Name=='Catelyn Stark', "Total.Chapters..COK."] <- 7
got7B[got7B$Name=='Catelyn Stark', "Total.Pages..SOS."] <- 96
got7B[got7B$Name=='Catelyn Stark', "Total.Chapters..SOS."] <- 7
got7B[got7B$Name=='Catelyn Stark', "Total.Pages..FFC."] <- 0
got7B[got7B$Name=='Catelyn Stark', "Total.Chapters..FFC."] <- 0
got7B[got7B$Name=='Catelyn Stark', "Total.Pages..DWD."] <- 0
got7B[got7B$Name=='Catelyn Stark', "Total.Chapters..DWD."] <- 0

got7B[got7B$Name=='Eddard Stark', "first_appearance"] <- 2011
got7B[got7B$Name=='Eddard Stark', "episodes_appeared"] <- 10
got7B[got7B$Name=='Eddard Stark', "last_appearance"] <- 2011
got7B[got7B$Name=='Eddard Stark', "screentime"] <- 99.45
Data Wrangling and Summary Statistics
I manipulated and organized the data using dplyr functions in order to show certain relationships between the variables under certain conditions. First, I ommitted rows with NA’s to create a new dataset with only POV characters from both the books and the show (the list is small) and showed which book POV characters have the most screentime in the show. I also did this with non-book POV characters using dplyr functions filter and arrange to show which characters on the show had the most screentime without having any POV chapters in the books.
I also made summary statistic for screentime and word count to show which of the main characters had the most lines and which were on screen the most. The results were expected, showing characters like Tyrion having many lines while he was on screen, whereas action characters such as Jon Snow have a lot of screentime but relatively fewer dialogue. I used dplyr function mutate to create new variables that show the ratio between WordCount and screentime for the POV characters, as well as to see how long the POV chapters tend to be for each character.
It was not surprising to find that Tyrion was the character with the max word count at 233876 words. Of all the main characters, Catelyn Stark had the highest wordcount in the books relative to her screentime in the show, while Melisandre had the lowest. This isn’t surprising as Melisandre was a less impactful POV character in the books while she was one of the main characters in the show. Brienne of Tarth had the longest chapters on average, while Ned Stark had the shortest chapters. I believe this is due to the fact that chapters were shorter on average in the earlier books of the series when Eddard was alive, and then by the 4th book (A Feast for Crows) the chapters became much longer and that is when Brienne of Tarth became a POV character.
#Book and Show POV characters organized by screentime
got7_pov <- got7B %>% arrange(desc(screentime)) %>% na.omit()
head(got7_pov)
## # A tibble: 6 x 18
## # Groups: Name [6]
## Name episodes_appear… first_appearance last_appearance WordCount Total.Pages
## <chr> <int> <int> <int> <int> <int>
## 1 Tyrio… 67 2011 2019 233876 649
## 2 Jon S… 62 2011 2019 204275 553
## 3 Daene… 62 2011 2019 162374 434
## 4 Cerse… 62 2011 2019 77016 247
## 5 Sansa… 59 2011 2019 107834 317
## 6 Arya … 59 2011 2019 151797 433
## # … with 12 more variables: Total.Chapters <int>, Total.Pages..GOT. <int>,
## # Total.Chapters..GOT. <int>, Total.Pages..COK. <int>,
## # Total.Chapters..COK. <int>, Total.Pages..SOS. <int>,
## # Total.Chapters..SOS. <int>, Total.Pages..FFC. <int>,
## # Total.Chapters..FFC. <int>, Total.Pages..DWD. <int>,
## # Total.Chapters..DWD. <int>, screentime <dbl>#Which non POV characters from the books had the most screentime in the show?
got7_nonpov <- got7 %>% filter(is.na(WordCount)) %>% arrange(desc(screentime))
got7_nonpov <- subset(got7_nonpov, Name!="Daenerys Targaryen" & Name!="Eddard 'Ned' Stark")
head(got7_nonpov)## Name actor_ess episodes_appeared
## 2 Jorah Mormont Iain Glen 52
## 3 Petyr 'Littlefinger' Baelish Aidan Gillen 41
## 5 Lord Varys Conleth Hill 46
## 6 Tywin Lannister Charles Dance 27
## 7 Margaery Tyrell Natalie Dormer 26
## first_appearance last_appearance WordCount Total.Pages Total.Chapters
## 2 2011 2019 NA NA NA
## 3 2011 2017 NA NA NA
## 5 2011 2019 NA NA NA
## 6 2011 2015 NA NA NA
## 7 2012 2016 NA NA NA
## Total.Pages..GOT. Total.Chapters..GOT. Total.Pages..COK. Total.Chapters..COK.
## 2 NA NA NA NA
## 3 NA NA NA NA
## 5 NA NA NA NA
## 6 NA NA NA NA
## 7 NA NA NA NA
## Total.Pages..SOS. Total.Chapters..SOS. Total.Pages..FFC. Total.Chapters..FFC.
## 2 NA NA NA NA
## 3 NA NA NA NA
## 5 NA NA NA NA
## 6 NA NA NA NA
## 7 NA NA NA NA
## Total.Pages..DWD. Total.Chapters..DWD. screentime episodes
## 2 NA NA 117.30 42
## 3 NA NA 102.15 35
## 5 NA NA 81.45 36
## 6 NA NA 78.15 27
## 7 NA NA 78.00 26
## [ reached 'max' / getOption("max.print") -- omitted 1 rows ]#Summary Statistics
#Screentime statistics for POV characters
sum_screentime <- got7 %>% na.omit() %>% summarize(mean_screentime=mean(screentime), sd_screentime=sd(screentime), min_screentime=min(screentime), max_screentime=max(screentime))
print(sum_screentime)## mean_screentime sd_screentime min_screentime max_screentime
## 1 128.8333 88.78791 3.45 293.3#Wordcount statistics for POV characters
sum_wordcount <- got7 %>% na.omit() %>% summarize(mean_wordcount=mean(WordCount), sd_wordcount=sd(WordCount), min_wordcount=min(WordCount), max_wordcount=max(WordCount))
print(sum_wordcount)## mean_wordcount sd_wordcount min_wordcount max_wordcount
## 1 84140.13 68100.16 5701 233876#Adding WordCount to Screentime ratio for POV characters
got7_pov <- got7_pov %>% mutate(screenword_ratio = WordCount/screentime)
#Adding WordCount per Chapter ratio for POV characters
got7_pov <- got7_pov %>% mutate(wordchapter_ratio = WordCount/Total.Chapters)Data Visualization
After generating summary statistics for all the variables applied to POV and non-POV characters, I’ve created some graphical displays to visually demonstrate and compare the data. In the plot below I compared the POV characters to see who had the highest values for both word count and screentime. The points that are significantly above the regression line represent characters who played a greater role in the show than the books, and the points below the line represent characters who played a greater role in the books. Following the trend from previous analysis, characters like Tyrion Lannister, Jon Snow, and Daenerys were the most impactful in both mediums of the story. Characters like Cersei Lannister and Sansa had a greater show presence while Catelyn and Bran had a greater book presence.
It is peculiar that of all the characters who survive to the last episode of the TV series, Bran Stark was the one with the lowest amount of screentime.
library(ggplot2)
library(ggrepel)

charplot1 <- ggplot(got7_pov, aes(x=WordCount,y=screentime, label=Name)) + geom_point(shape = 9,color="firebrick") + geom_smooth(method=lm, color="grey20") + geom_text_repel(aes(label = Name),box.padding   = .95, point.padding = 0.9,segment.color = 'grey50')

charplot1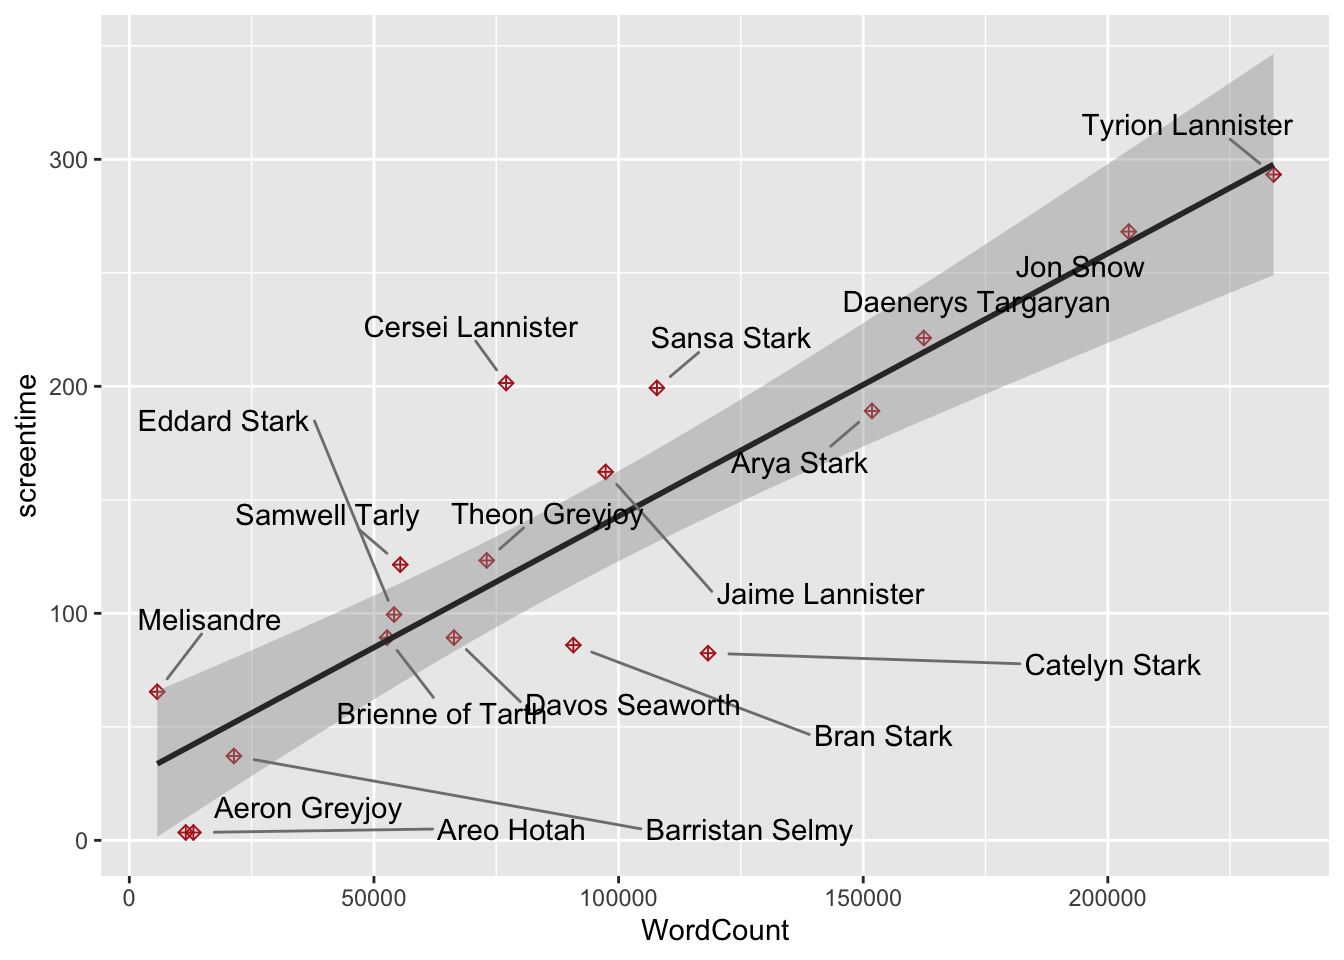
I made a correlation heatmap to show which of the numeric variables had a high correlation with each other. Most of the statistics correlate very highly, which is expected as a greater amount of time on screen is usually associated with more dialogue/speaking lines and importance to the story. I was surprised to see that there’s a lower correlation between the number of episodes a show character appears in and their wordcount in the books. This demonstrates that there is a difference between how important the character might be in the show vs. the books.
#Correlation Heatmap

got_mat <- got7 %>% dplyr::select(episodes_appeared, WordCount, Total.Pages, Total.Chapters, screentime, episodes)

got_cormat <- got_mat %>% select_if(is.numeric) %>% cor(use="pair")

got_tidycor <- got_cormat %>% as.data.frame %>% rownames_to_column("var1") %>%  pivot_longer(-1,names_to="var2",values_to="correlation")

got_tidycor
## # A tibble: 25 x 3
## var1 var2 correlation
## <chr> <chr> <dbl>
## 1 episodes_appeared episodes_appeared 1
## 2 episodes_appeared WordCount 0.738
## 3 episodes_appeared Total.Pages 0.851
## 4 episodes_appeared Total.Chapters 0.807
## 5 episodes_appeared screentime 0.894
## 6 WordCount episodes_appeared 0.738
## 7 WordCount WordCount 1
## 8 WordCount Total.Pages 0.998
## 9 WordCount Total.Chapters 0.991
## 10 WordCount screentime 0.885
## # … with 15 more rowsgot_tidycor%>%ggplot(aes(var1,var2,fill=correlation))+ geom_tile()+ scale_fill_gradient2(low="red",mid="white",high="blue")+ geom_text(aes(label=round(correlation,2)),color = "black", size = 4)+ theme(axis.text.x = element_text(angle = 90, hjust=1))+ coord_fixed()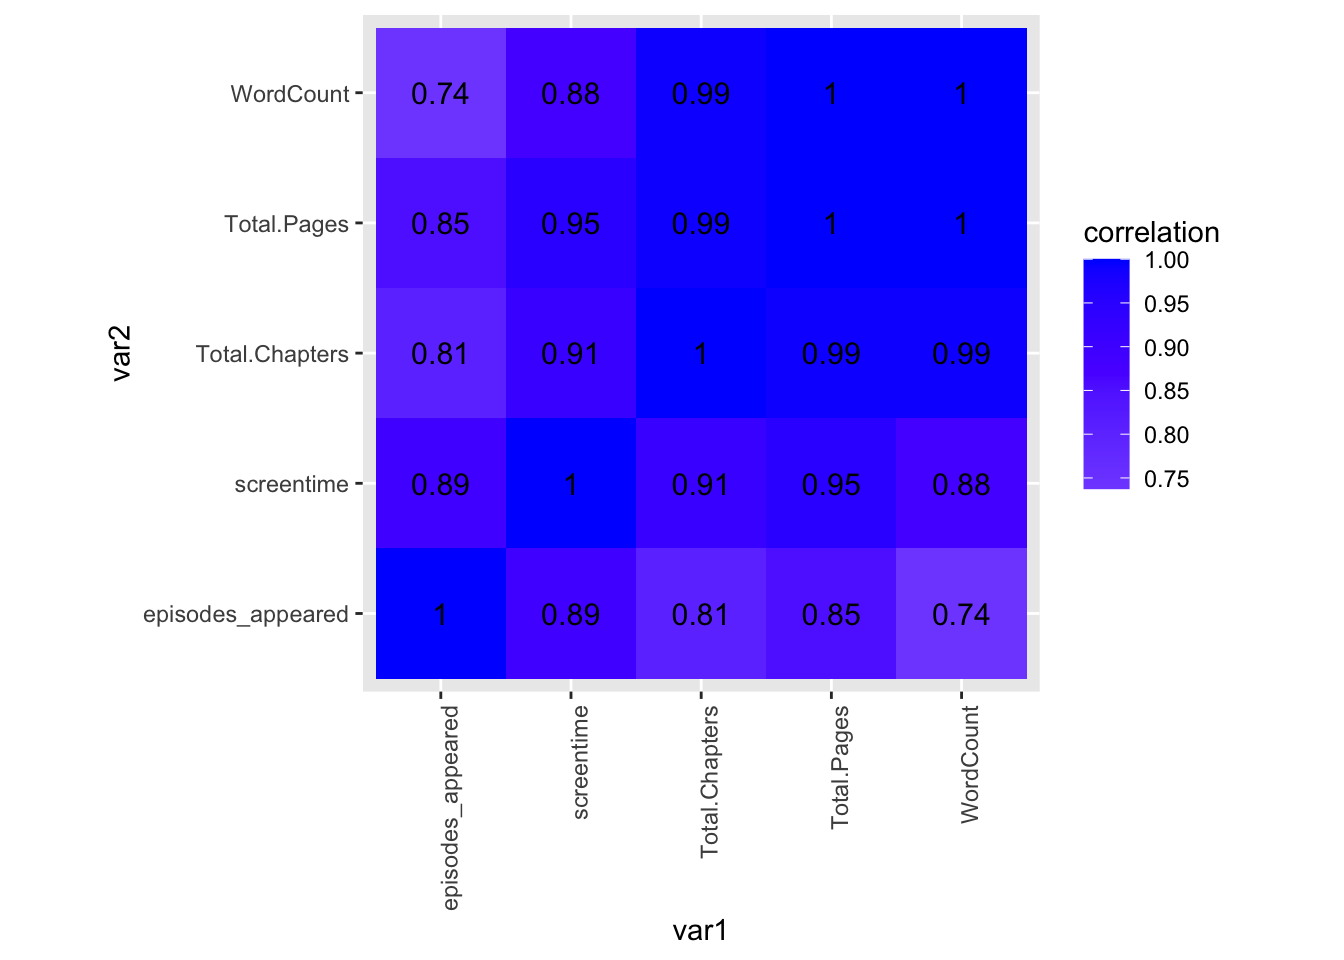
Other Plots
In my first plot I showed a relationship between episode appearances and screentime, as well as demonstrating with the color aesthetic that there are some non POV characters (grey dots) that have more screen time than book POV characters (green dots).
library(ggplot2)

ggplot(got7B, aes(x=`episodes_appeared`, y=screentime)) + geom_point(aes(color=WordCount)) + geom_smooth(method="lm") +scale_color_gradient(low="darkolivegreen2", high="red") + geom_text_repel(aes(label = Name))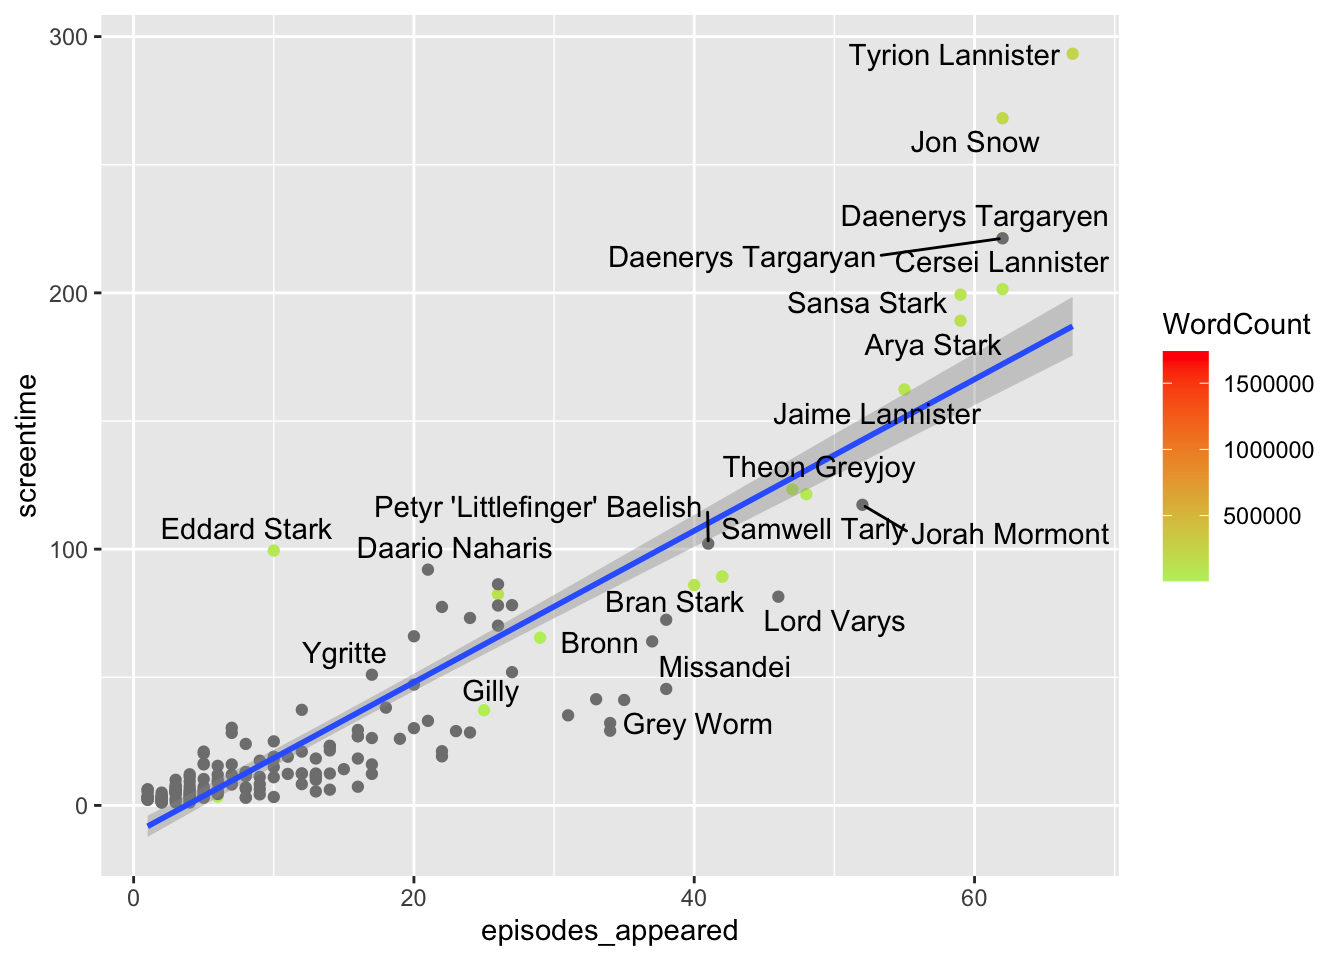
#geom_text_repel(aes(label = Name),box.padding   = 0.9, point.padding = 0.9,segment.color = #'grey50')

got7_pov2 <- got7_pov %>% filter(WordCount > 1)
K Means Clustering
got_mat1 <- got_mat %>% na.omit() %>% mutate_if(is.numeric,scale)
dist(got_mat1,method = "euclidean")
## 1 2 4 5 6 7 9
## 2 4.574011
## 4 5.070861 4.477387
## 5 7.705864 5.104968 3.125584
## 6 7.365881 5.417852 2.491295 1.096137
## 7 11.638975 9.032705 6.702387 4.060613 4.307177
## 9 17.714805 15.054043 12.698347 10.162805 10.368470 6.118604
## 10 15.704583 13.054562 10.705332 8.145741 8.352728 4.102480 2.035820
## 10 12 13 15 24 30 111
## 2
## 4
## 5
## 6
## 7
## 9
## 10
## [ reached getOption("max.print") -- omitted 7 rows ]kmeans1 <- got_mat1 %>% kmeans(3)
kmeansclust <- got_mat1 %>% mutate(cluster=as.factor(kmeans1$cluster))
kmeansclust %>% ggplot(aes(screentime,WordCount, color=cluster)) + geom_point()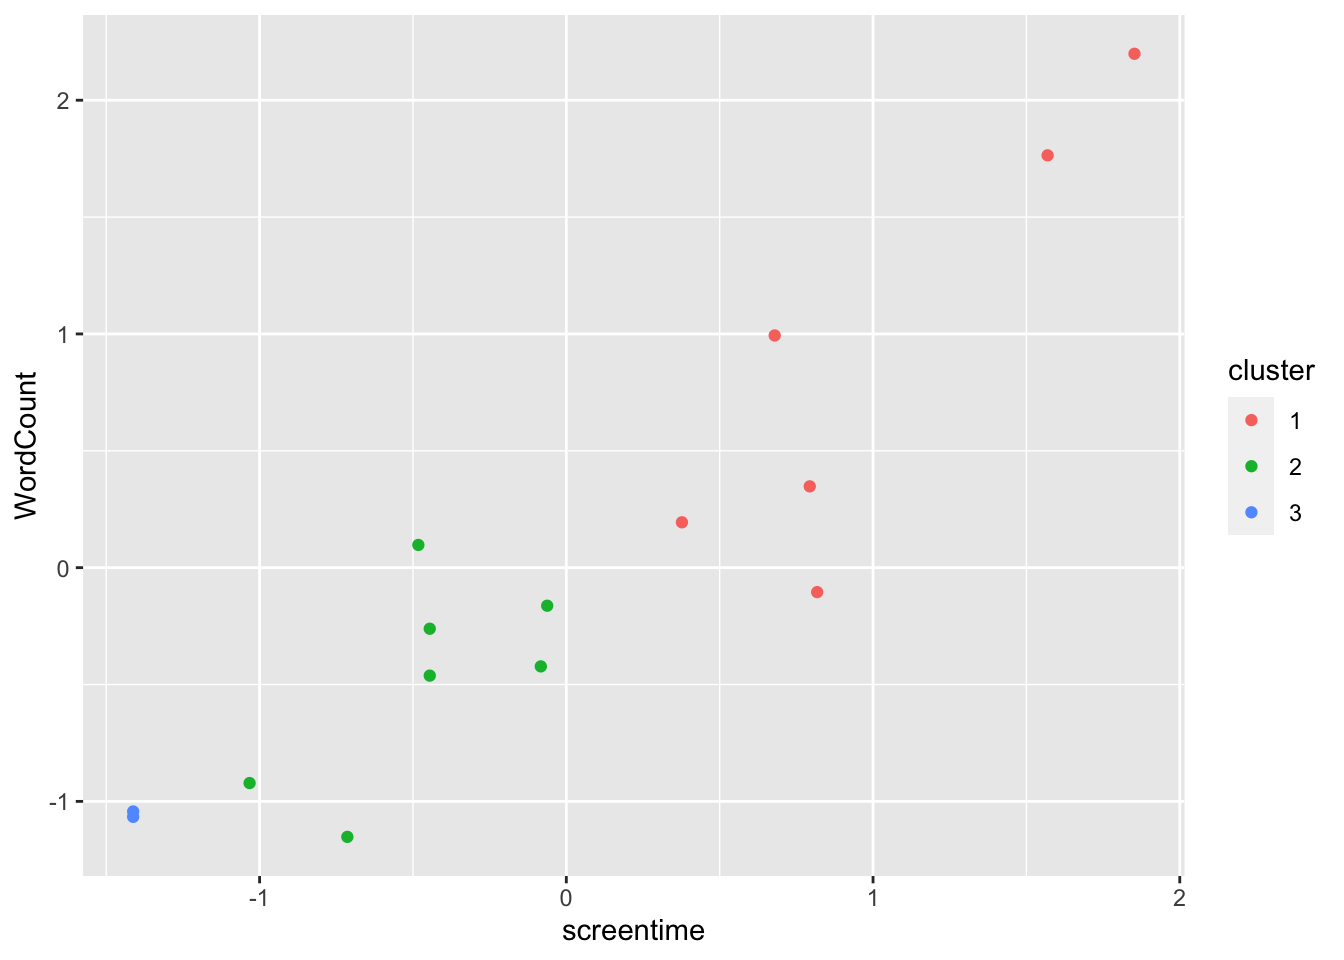
…